Options guide · Reviewed 27 August 2026
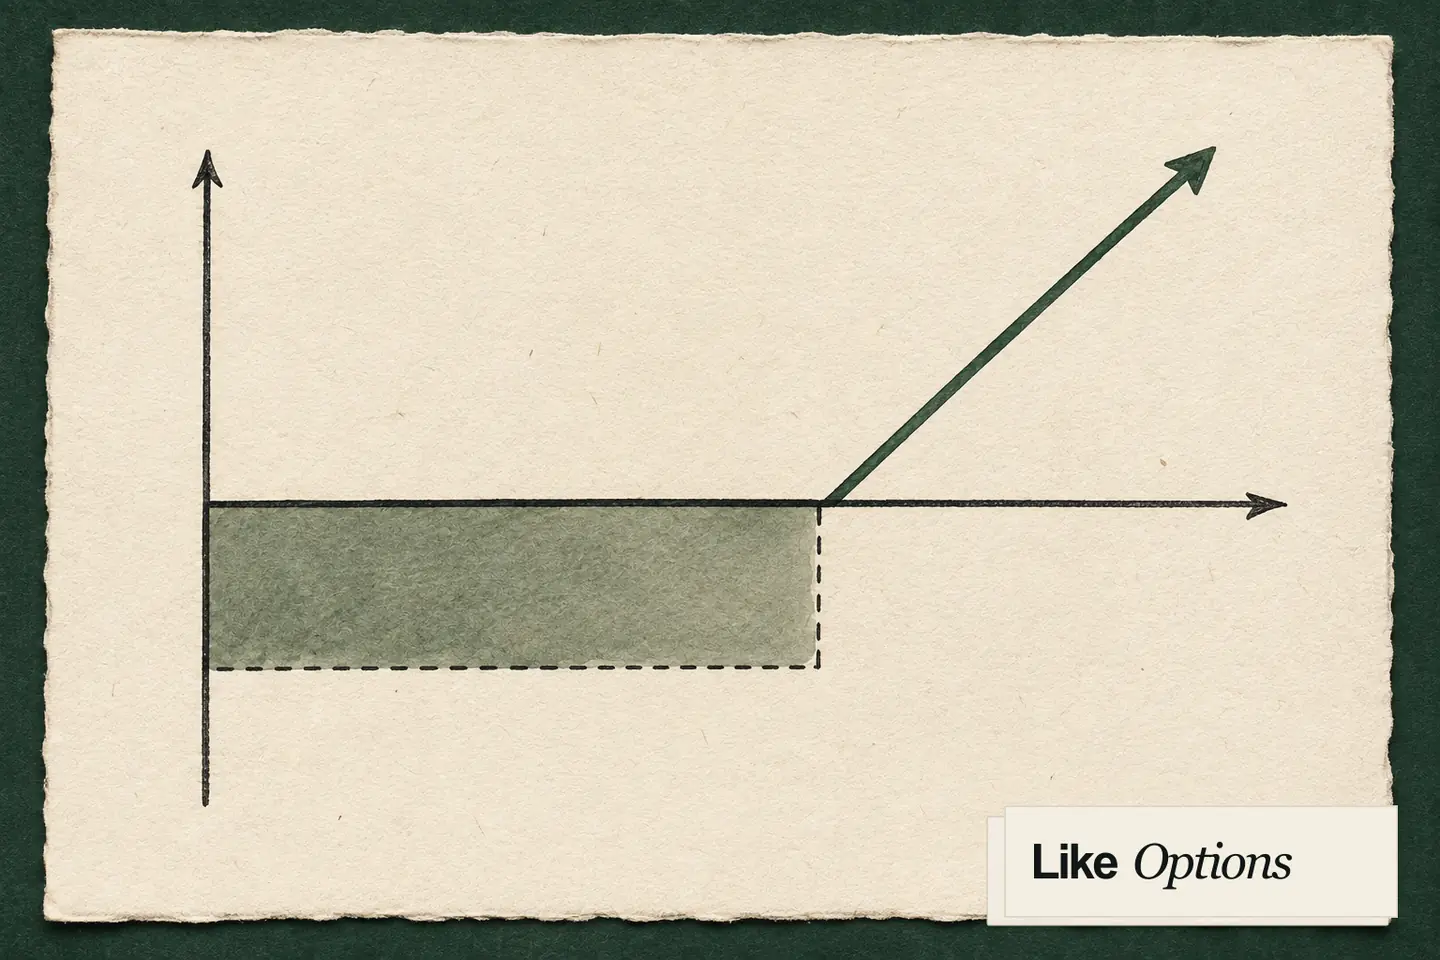
An options payoff graph is a map of outcomes at one destination: expiration.
The graph helps make structure visible. It does not predict the path the underlying asset takes or assign a probability to an outcome.
Start with the legs
Every position is a collection of legs. A long call gains intrinsic value above its strike but pays a premium up front. A long put gains value below its strike — the side-by-side comparison of call and put mechanics sets out that directional mirror in full before you start combining legs. Short legs reverse the payoff and can introduce materially different risk. Stock legs change the slope rather than behaving like options.
Read four landmarks
- Strike: where intrinsic value begins for an option leg.
- Premium: the entered cost or credit that shifts the final result.
- Breakeven: the underlying price where the combined payoff reaches zero at expiration.
- Shape: the visible limit, exposure and asymmetry of the complete position.
Why expiration is a boundary
Before expiration, time value, implied volatility, interest rates and the remaining term affect an option’s market price. A payoff chart that only uses intrinsic value deliberately omits those variables. It is useful for structure and risk boundaries, not for live valuation.
Open the Strategy Atlas ↗ Inspect a long call example ↗
Source note: Definitions follow standard option-payoff conventions. LikeOptions does not provide trading advice, suitability analysis, live quotes or a recommendation.